Federal budget and debt

Monthly Treasury figures are nominal dollars. OMB historical tables are fiscal years. A fiscal year starts on October 1 and can include two presidents.

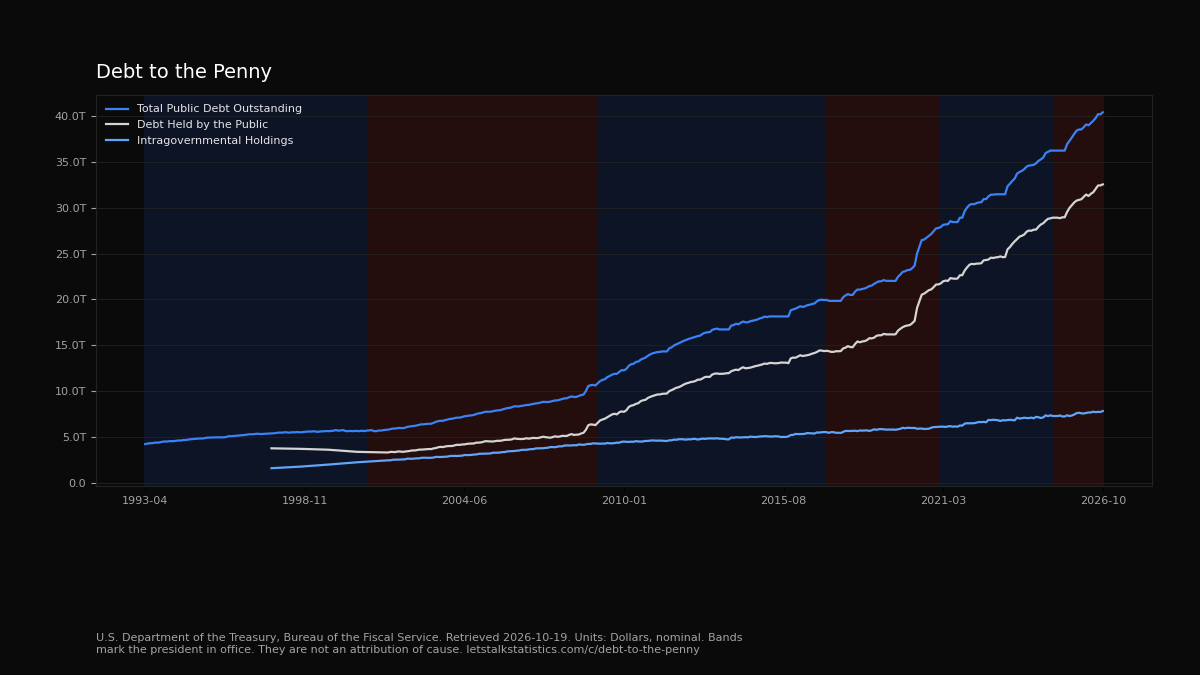
Debt to the Penny

Last Debt to the Penny record in each calendar month. Nominal dollars.

DemocraticRepublican

Background bands mark who was president. They are not an attribution of cause. Presidents do not solely control these metrics. Monthly points use the president in office on the first day of the month. Calendar year points use the president in office on July 1. Fiscal year points use the president in office on October 1, the first day of that fiscal year. A fiscal year runs through the following September 30 and can include two presidents.

Total Public Debt Outstanding
Units: Dollars, nominal. Nominal. not applicable.
Month value is the last Debt to the Penny record in that calendar month.
Source: U.S. Department of the Treasury, Bureau of the Fiscal Service, Debt to the Penny. Retrieved 2026-10-19. Series: fiscaldata.treasury.gov/datasets/debt-to-the-penny/debt-to-the-penny
Debt Held by the Public
Units: Dollars, nominal. Nominal. not applicable.
Month value is the last Debt to the Penny record in that calendar month.
Source: U.S. Department of the Treasury, Bureau of the Fiscal Service, Debt to the Penny. Retrieved 2026-10-19. Series: fiscaldata.treasury.gov/datasets/debt-to-the-penny/debt-to-the-penny
Intragovernmental Holdings
Units: Dollars, nominal. Nominal. not applicable.
Month value is the last Debt to the Penny record in that calendar month.
Source: U.S. Department of the Treasury, Bureau of the Fiscal Service, Debt to the Penny. Retrieved 2026-10-19. Series: fiscaldata.treasury.gov/datasets/debt-to-the-penny/debt-to-the-penny
Chart imagePermalink

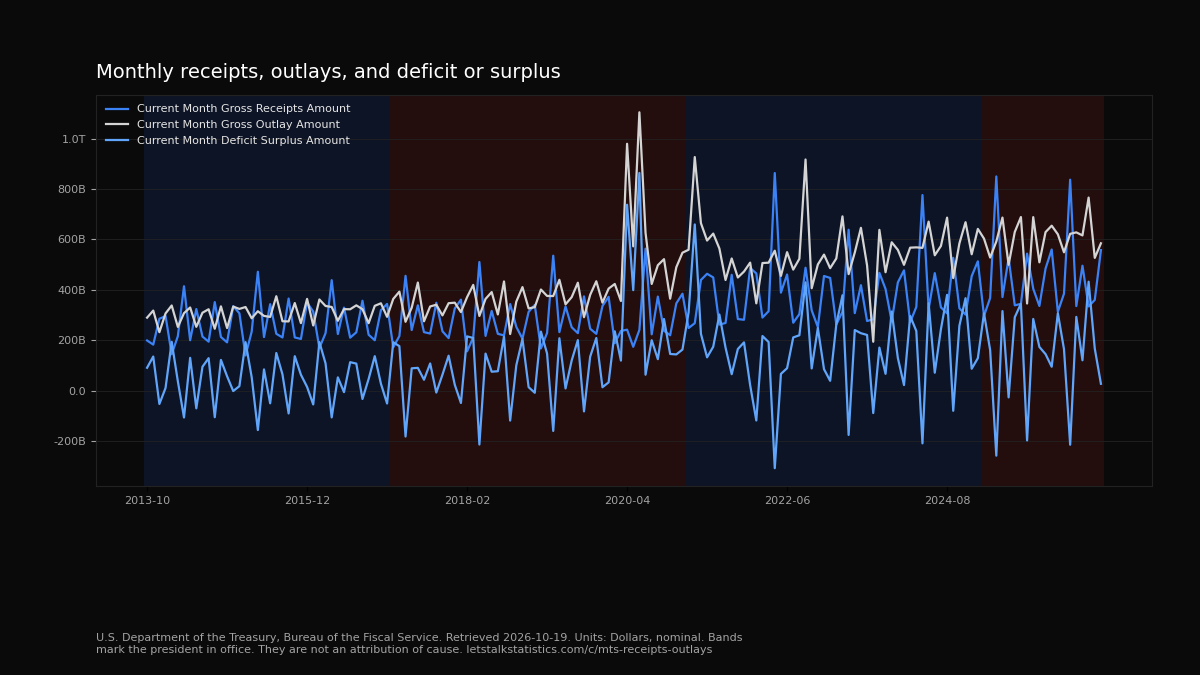
Monthly receipts, outlays, and deficit or surplus

Monthly Treasury Statement Table 1. The deficit or surplus field equals outlays minus receipts. Nominal dollars.

DemocraticRepublican

Background bands mark who was president. They are not an attribution of cause. Presidents do not solely control these metrics. Monthly points use the president in office on the first day of the month. Calendar year points use the president in office on July 1. Fiscal year points use the president in office on October 1, the first day of that fiscal year. A fiscal year runs through the following September 30 and can include two presidents.

Current Month Gross Receipts Amount
Units: Dollars, nominal. Nominal. not applicable.
When a calendar month appears on more than one statement, the row from the latest record_date is kept. Current Month Deficit Surplus Amount equals outlays minus receipts on the published rows.
Source: U.S. Department of the Treasury, Bureau of the Fiscal Service, Monthly Treasury Statement, Table 1, Summary of Receipts, Outlays, and the Deficit/Surplus of the U.S. Government. Retrieved 2026-10-19. Series: fiscaldata.treasury.gov/datasets/monthly-treasury-statement/summary-of-receipts-outlays-and-the-deficit-surplus-of-the-u-s-government
Current Month Gross Outlay Amount
Units: Dollars, nominal. Nominal. not applicable.
When a calendar month appears on more than one statement, the row from the latest record_date is kept. Current Month Deficit Surplus Amount equals outlays minus receipts on the published rows.
Source: U.S. Department of the Treasury, Bureau of the Fiscal Service, Monthly Treasury Statement, Table 1, Summary of Receipts, Outlays, and the Deficit/Surplus of the U.S. Government. Retrieved 2026-10-19. Series: fiscaldata.treasury.gov/datasets/monthly-treasury-statement/summary-of-receipts-outlays-and-the-deficit-surplus-of-the-u-s-government
Current Month Deficit Surplus Amount
Units: Dollars, nominal. Nominal. not applicable.
When a calendar month appears on more than one statement, the row from the latest record_date is kept. Current Month Deficit Surplus Amount equals outlays minus receipts on the published rows.
Source: U.S. Department of the Treasury, Bureau of the Fiscal Service, Monthly Treasury Statement, Table 1, Summary of Receipts, Outlays, and the Deficit/Surplus of the U.S. Government. Retrieved 2026-10-19. Series: fiscaldata.treasury.gov/datasets/monthly-treasury-statement/summary-of-receipts-outlays-and-the-deficit-surplus-of-the-u-s-government
Chart imagePermalink

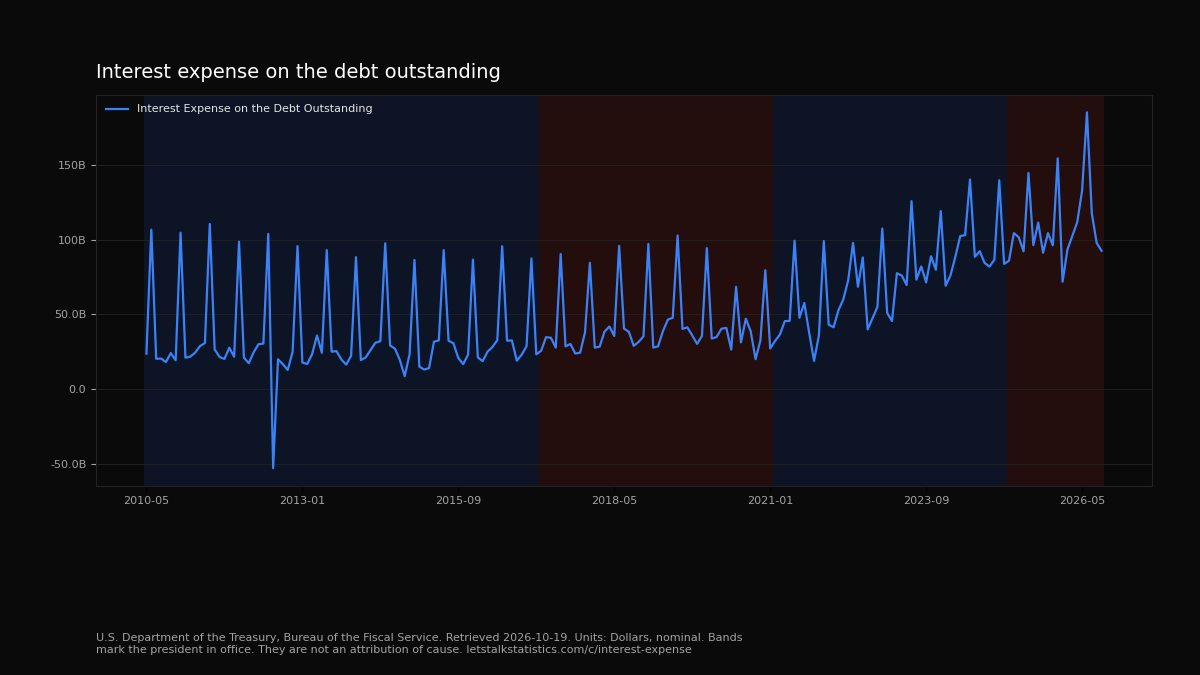
Interest expense on the debt outstanding

Sum of the published monthly component lines. Nominal dollars.

DemocraticRepublican

Background bands mark who was president. They are not an attribution of cause. Presidents do not solely control these metrics. Monthly points use the president in office on the first day of the month. Calendar year points use the president in office on July 1. Fiscal year points use the president in office on October 1, the first day of that fiscal year. A fiscal year runs through the following September 30 and can include two presidents.

Interest Expense on the Debt Outstanding
Units: Dollars, nominal. Nominal. not applicable.
Sum of month_expense_amt across every line on that record date. Lines are the published components. No total line is published in the file.
Source: U.S. Department of the Treasury, Bureau of the Fiscal Service, Interest Expense on the Debt Outstanding. Retrieved 2026-10-19. Series: fiscaldata.treasury.gov/datasets/interest-expense-debt-outstanding/interest-expense-on-the-debt-outstanding
Chart imagePermalink

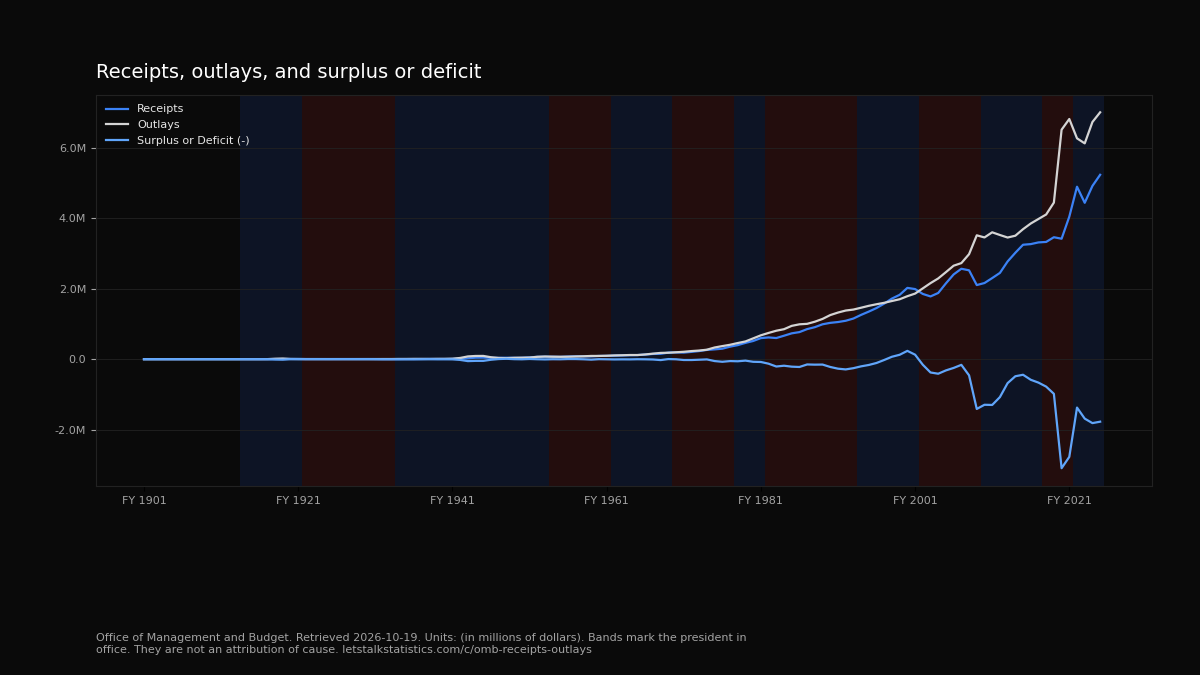
Receipts, outlays, and surplus or deficit

OMB Historical Table 1.1. Total, in millions of dollars. Single fiscal years only. Budget figures before 1933 use the Administrative Budget.

DemocraticRepublican

Background bands mark who was president. They are not an attribution of cause. Presidents do not solely control these metrics. Monthly points use the president in office on the first day of the month. Calendar year points use the president in office on July 1. Fiscal year points use the president in office on October 1, the first day of that fiscal year. A fiscal year runs through the following September 30 and can include two presidents.

Receipts
Units: (in millions of dollars). Nominal. fiscal year.
Note: Budget figures prior to 1933 are based on the "Administrative Budget" concepts rather than the "Unified Budget" concepts.
Source: Office of Management and Budget, Table 1.1 - SUMMARY OF RECEIPTS, OUTLAYS, AND SURPLUSES OR DEFICITS ( - ): 1789 - 2025. Retrieved 2026-10-19. Series: www.whitehouse.gov/wp-content/uploads/2026/04/hist01z1_fy2027.xlsx
Outlays
Units: (in millions of dollars). Nominal. fiscal year.
Note: Budget figures prior to 1933 are based on the "Administrative Budget" concepts rather than the "Unified Budget" concepts.
Source: Office of Management and Budget, Table 1.1 - SUMMARY OF RECEIPTS, OUTLAYS, AND SURPLUSES OR DEFICITS ( - ): 1789 - 2025. Retrieved 2026-10-19. Series: www.whitehouse.gov/wp-content/uploads/2026/04/hist01z1_fy2027.xlsx
Surplus or Deficit (-)
Units: (in millions of dollars). Nominal. fiscal year.
Note: Budget figures prior to 1933 are based on the "Administrative Budget" concepts rather than the "Unified Budget" concepts.
Source: Office of Management and Budget, Table 1.1 - SUMMARY OF RECEIPTS, OUTLAYS, AND SURPLUSES OR DEFICITS ( - ): 1789 - 2025. Retrieved 2026-10-19. Series: www.whitehouse.gov/wp-content/uploads/2026/04/hist01z1_fy2027.xlsx
Chart imagePermalink

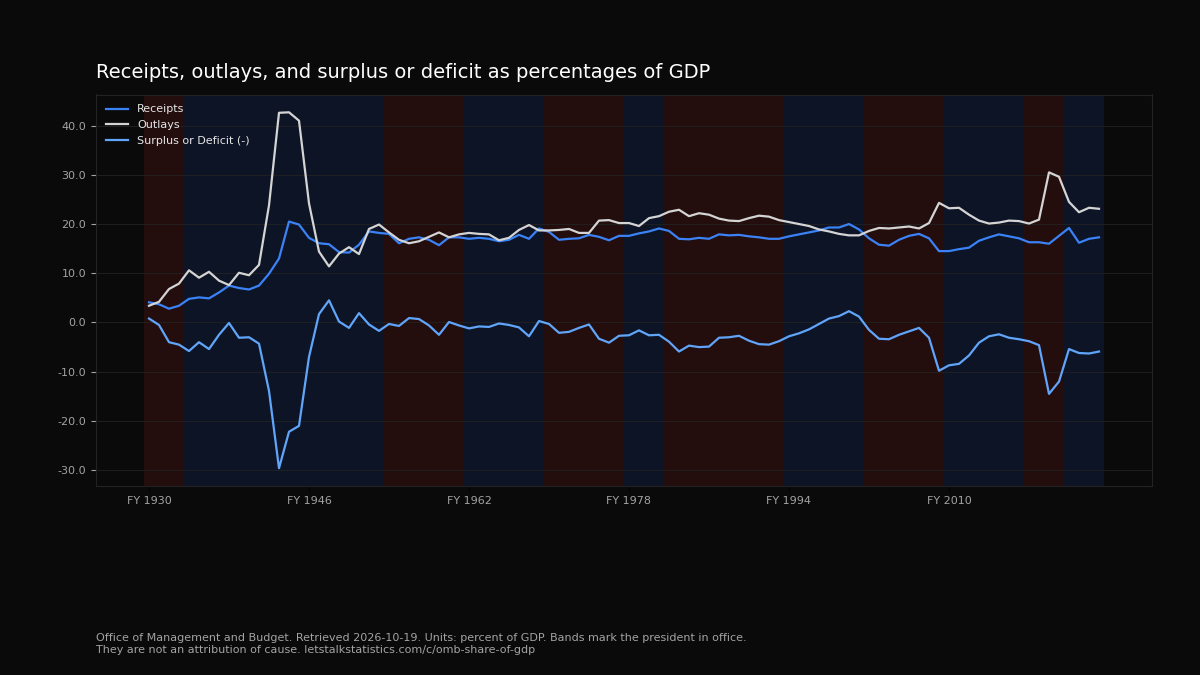
Receipts, outlays, and surplus or deficit as percentages of GDP

OMB Historical Table 1.2.

DemocraticRepublican

Background bands mark who was president. They are not an attribution of cause. Presidents do not solely control these metrics. Monthly points use the president in office on the first day of the month. Calendar year points use the president in office on July 1. Fiscal year points use the president in office on October 1, the first day of that fiscal year. A fiscal year runs through the following September 30 and can include two presidents.

Receipts
Units: percent of GDP. Share of GDP. fiscal year.
Table 1.2 - SUMMARY OF RECEIPTS, OUTLAYS, AND SURPLUSES OR DEFICITS ( - ) AS PERCENTAGES OF GDP: 1930 - 2025
Source: Office of Management and Budget, Table 1.2 - SUMMARY OF RECEIPTS, OUTLAYS, AND SURPLUSES OR DEFICITS ( - ) AS PERCENTAGES OF GDP: 1930 - 2025. Retrieved 2026-10-19. Series: www.whitehouse.gov/wp-content/uploads/2026/04/hist01z2_fy2027.xlsx
Outlays
Units: percent of GDP. Share of GDP. fiscal year.
Table 1.2 - SUMMARY OF RECEIPTS, OUTLAYS, AND SURPLUSES OR DEFICITS ( - ) AS PERCENTAGES OF GDP: 1930 - 2025
Source: Office of Management and Budget, Table 1.2 - SUMMARY OF RECEIPTS, OUTLAYS, AND SURPLUSES OR DEFICITS ( - ) AS PERCENTAGES OF GDP: 1930 - 2025. Retrieved 2026-10-19. Series: www.whitehouse.gov/wp-content/uploads/2026/04/hist01z2_fy2027.xlsx
Surplus or Deficit (-)
Units: percent of GDP. Share of GDP. fiscal year.
Table 1.2 - SUMMARY OF RECEIPTS, OUTLAYS, AND SURPLUSES OR DEFICITS ( - ) AS PERCENTAGES OF GDP: 1930 - 2025
Source: Office of Management and Budget, Table 1.2 - SUMMARY OF RECEIPTS, OUTLAYS, AND SURPLUSES OR DEFICITS ( - ) AS PERCENTAGES OF GDP: 1930 - 2025. Retrieved 2026-10-19. Series: www.whitehouse.gov/wp-content/uploads/2026/04/hist01z2_fy2027.xlsx
Chart imagePermalink

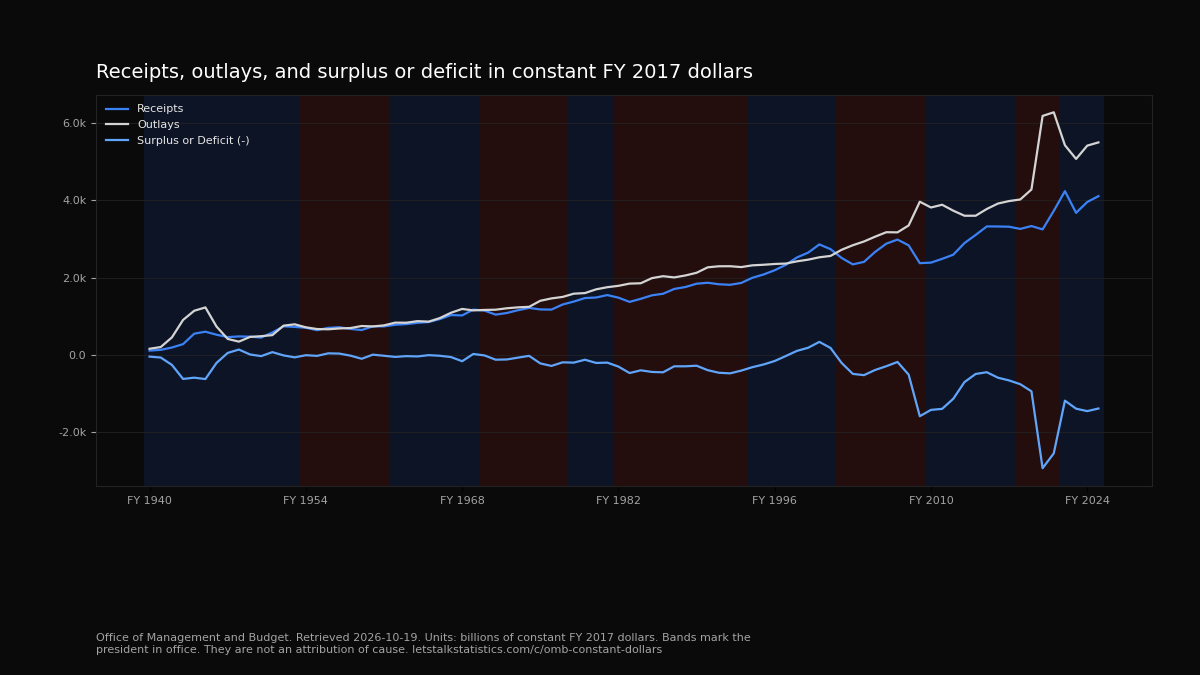
Receipts, outlays, and surplus or deficit in constant FY 2017 dollars

OMB Historical Table 1.3. Billions of constant FY 2017 dollars.

DemocraticRepublican

Background bands mark who was president. They are not an attribution of cause. Presidents do not solely control these metrics. Monthly points use the president in office on the first day of the month. Calendar year points use the president in office on July 1. Fiscal year points use the president in office on October 1, the first day of that fiscal year. A fiscal year runs through the following September 30 and can include two presidents.

Receipts
Units: billions of constant FY 2017 dollars. Inflation-adjusted. fiscal year.
Constant dollars use the composite deflator published in this table. Base: FY 2017 dollars.
Source: Office of Management and Budget, Table 1.3 - SUMMARY OF RECEIPTS, OUTLAYS, AND SURPLUSES OR DEFICITS ( - ) IN CURRENT DOLLARS, CONSTANT (FY 2017) DOLLARS, AND AS PERCENTAGES OF GDP: 1940 - 2025. Retrieved 2026-10-19. Series: www.whitehouse.gov/wp-content/uploads/2026/04/hist01z3_fy2027.xlsx
Outlays
Units: billions of constant FY 2017 dollars. Inflation-adjusted. fiscal year.
Constant dollars use the composite deflator published in this table. Base: FY 2017 dollars.
Source: Office of Management and Budget, Table 1.3 - SUMMARY OF RECEIPTS, OUTLAYS, AND SURPLUSES OR DEFICITS ( - ) IN CURRENT DOLLARS, CONSTANT (FY 2017) DOLLARS, AND AS PERCENTAGES OF GDP: 1940 - 2025. Retrieved 2026-10-19. Series: www.whitehouse.gov/wp-content/uploads/2026/04/hist01z3_fy2027.xlsx
Surplus or Deficit (-)
Units: billions of constant FY 2017 dollars. Inflation-adjusted. fiscal year.
Constant dollars use the composite deflator published in this table. Base: FY 2017 dollars.
Source: Office of Management and Budget, Table 1.3 - SUMMARY OF RECEIPTS, OUTLAYS, AND SURPLUSES OR DEFICITS ( - ) IN CURRENT DOLLARS, CONSTANT (FY 2017) DOLLARS, AND AS PERCENTAGES OF GDP: 1940 - 2025. Retrieved 2026-10-19. Series: www.whitehouse.gov/wp-content/uploads/2026/04/hist01z3_fy2027.xlsx
Chart imagePermalink

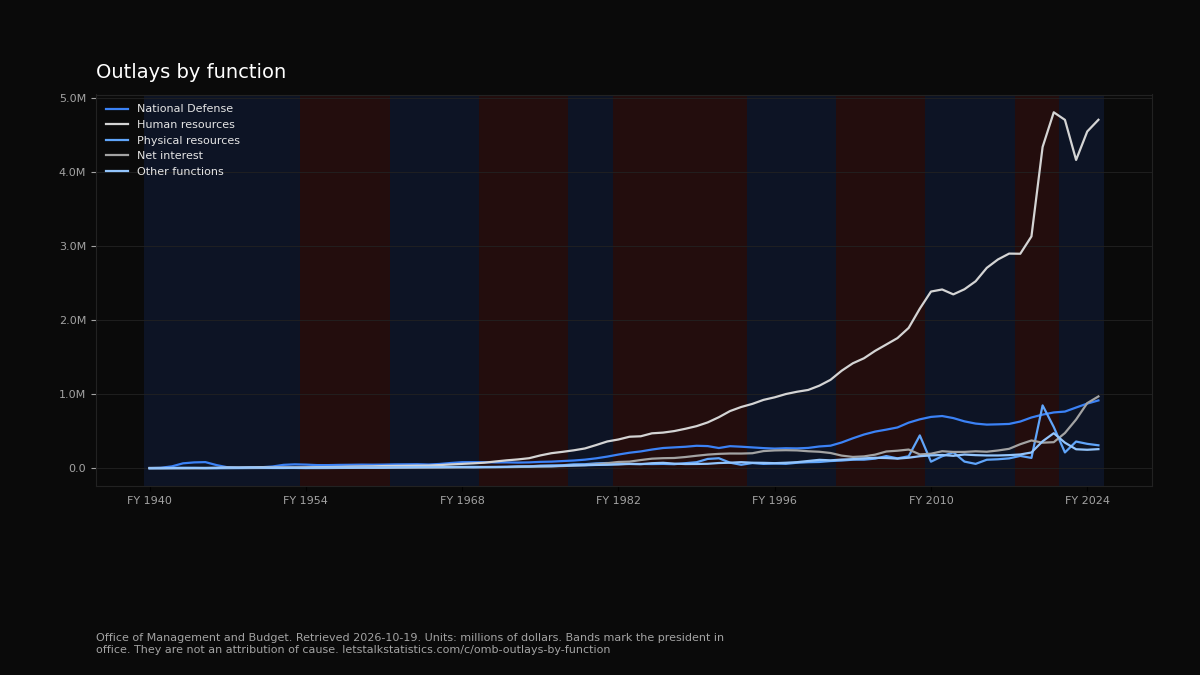
Outlays by function

OMB Historical Table 3.1, millions of dollars. Estimate columns are omitted. Labels are the table labels.

DemocraticRepublican

Background bands mark who was president. They are not an attribution of cause. Presidents do not solely control these metrics. Monthly points use the president in office on the first day of the month. Calendar year points use the president in office on July 1. Fiscal year points use the president in office on October 1, the first day of that fiscal year. A fiscal year runs through the following September 30 and can include two presidents.

National Defense
Units: millions of dollars. Nominal. fiscal year.
Estimate columns in the source table are omitted.
Source: Office of Management and Budget, Table 3.1 - OUTLAYS BY SUPERFUNCTION AND FUNCTION: 1940 - 2031. Retrieved 2026-10-19. Series: www.whitehouse.gov/wp-content/uploads/2026/04/hist03z1_fy2027.xlsx
Human resources
Units: millions of dollars. Nominal. fiscal year.
Estimate columns in the source table are omitted.
Source: Office of Management and Budget, Table 3.1 - OUTLAYS BY SUPERFUNCTION AND FUNCTION: 1940 - 2031. Retrieved 2026-10-19. Series: www.whitehouse.gov/wp-content/uploads/2026/04/hist03z1_fy2027.xlsx
Physical resources
Units: millions of dollars. Nominal. fiscal year.
Estimate columns in the source table are omitted.
Source: Office of Management and Budget, Table 3.1 - OUTLAYS BY SUPERFUNCTION AND FUNCTION: 1940 - 2031. Retrieved 2026-10-19. Series: www.whitehouse.gov/wp-content/uploads/2026/04/hist03z1_fy2027.xlsx
Net interest
Units: millions of dollars. Nominal. fiscal year.
Estimate columns in the source table are omitted.
Source: Office of Management and Budget, Table 3.1 - OUTLAYS BY SUPERFUNCTION AND FUNCTION: 1940 - 2031. Retrieved 2026-10-19. Series: www.whitehouse.gov/wp-content/uploads/2026/04/hist03z1_fy2027.xlsx
Other functions
Units: millions of dollars. Nominal. fiscal year.
Estimate columns in the source table are omitted.
Source: Office of Management and Budget, Table 3.1 - OUTLAYS BY SUPERFUNCTION AND FUNCTION: 1940 - 2031. Retrieved 2026-10-19. Series: www.whitehouse.gov/wp-content/uploads/2026/04/hist03z1_fy2027.xlsx
Chart imagePermalink

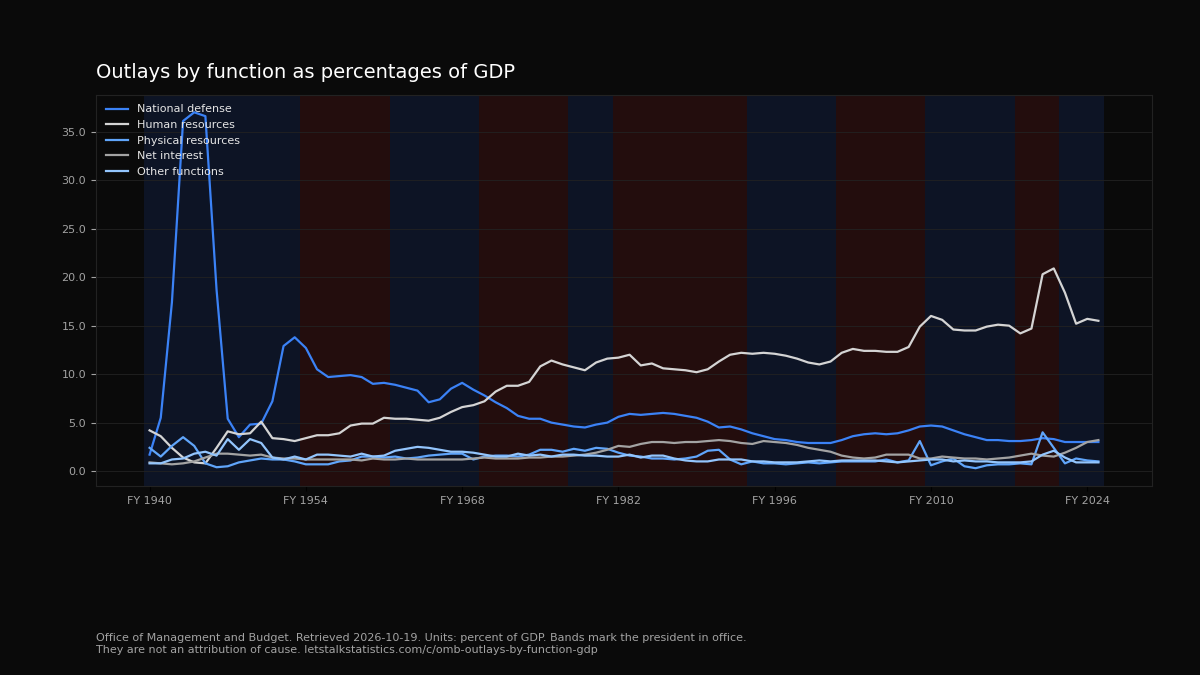
Outlays by function as percentages of GDP

OMB Historical Table 3.1, as percentages of GDP. Estimate columns are omitted.

DemocraticRepublican

Background bands mark who was president. They are not an attribution of cause. Presidents do not solely control these metrics. Monthly points use the president in office on the first day of the month. Calendar year points use the president in office on July 1. Fiscal year points use the president in office on October 1, the first day of that fiscal year. A fiscal year runs through the following September 30 and can include two presidents.

National defense
Units: percent of GDP. Share of GDP. fiscal year.
Estimate columns in the source table are omitted.
Source: Office of Management and Budget, Table 3.1 - OUTLAYS BY SUPERFUNCTION AND FUNCTION: 1940 - 2031. Retrieved 2026-10-19. Series: www.whitehouse.gov/wp-content/uploads/2026/04/hist03z1_fy2027.xlsx
Human resources
Units: percent of GDP. Share of GDP. fiscal year.
Estimate columns in the source table are omitted.
Source: Office of Management and Budget, Table 3.1 - OUTLAYS BY SUPERFUNCTION AND FUNCTION: 1940 - 2031. Retrieved 2026-10-19. Series: www.whitehouse.gov/wp-content/uploads/2026/04/hist03z1_fy2027.xlsx
Physical resources
Units: percent of GDP. Share of GDP. fiscal year.
Estimate columns in the source table are omitted.
Source: Office of Management and Budget, Table 3.1 - OUTLAYS BY SUPERFUNCTION AND FUNCTION: 1940 - 2031. Retrieved 2026-10-19. Series: www.whitehouse.gov/wp-content/uploads/2026/04/hist03z1_fy2027.xlsx
Net interest
Units: percent of GDP. Share of GDP. fiscal year.
Estimate columns in the source table are omitted.
Source: Office of Management and Budget, Table 3.1 - OUTLAYS BY SUPERFUNCTION AND FUNCTION: 1940 - 2031. Retrieved 2026-10-19. Series: www.whitehouse.gov/wp-content/uploads/2026/04/hist03z1_fy2027.xlsx
Other functions
Units: percent of GDP. Share of GDP. fiscal year.
Estimate columns in the source table are omitted.
Source: Office of Management and Budget, Table 3.1 - OUTLAYS BY SUPERFUNCTION AND FUNCTION: 1940 - 2031. Retrieved 2026-10-19. Series: www.whitehouse.gov/wp-content/uploads/2026/04/hist03z1_fy2027.xlsx
Chart imagePermalink

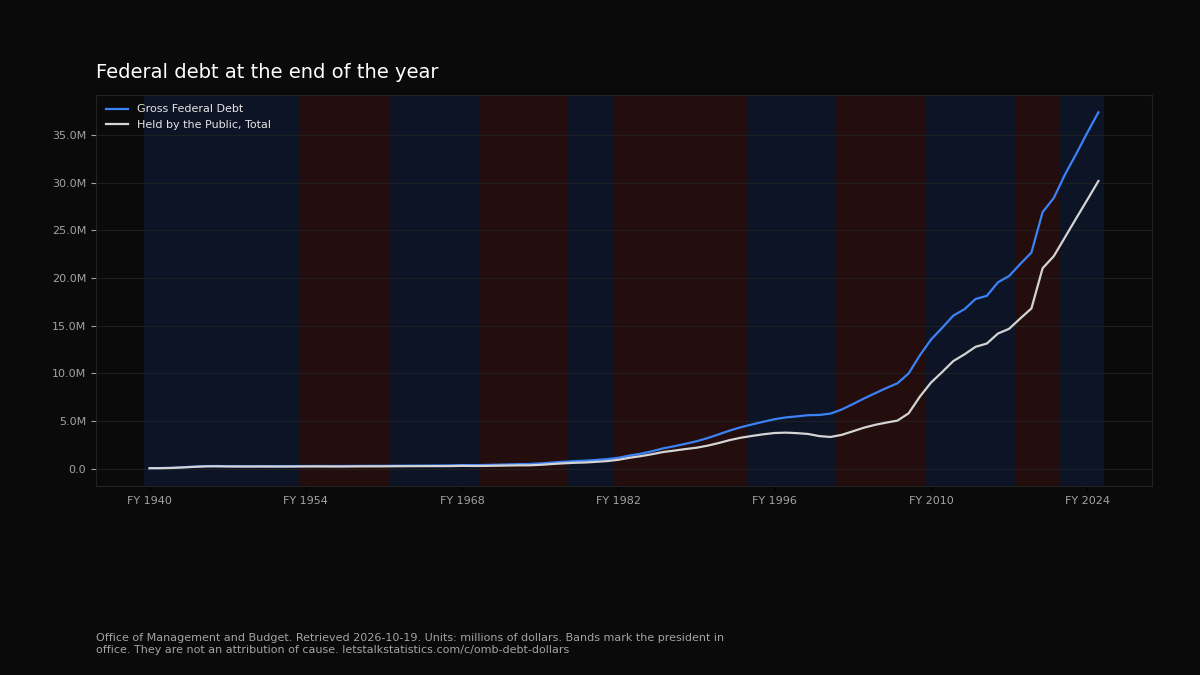
Federal debt at the end of the year

OMB Historical Table 7.1. Millions of dollars.

DemocraticRepublican

Background bands mark who was president. They are not an attribution of cause. Presidents do not solely control these metrics. Monthly points use the president in office on the first day of the month. Calendar year points use the president in office on July 1. Fiscal year points use the president in office on October 1, the first day of that fiscal year. A fiscal year runs through the following September 30 and can include two presidents.

Gross Federal Debt
Units: millions of dollars. Nominal. fiscal year.
Table 7.1 - FEDERAL DEBT AT THE END OF YEAR: 1940 - 2025
Source: Office of Management and Budget, Table 7.1 - FEDERAL DEBT AT THE END OF YEAR: 1940 - 2025. Retrieved 2026-10-19. Series: www.whitehouse.gov/wp-content/uploads/2026/04/hist07z1_fy2027.xlsx
Held by the Public, Total
Units: millions of dollars. Nominal. fiscal year.
Table 7.1 - FEDERAL DEBT AT THE END OF YEAR: 1940 - 2025
Source: Office of Management and Budget, Table 7.1 - FEDERAL DEBT AT THE END OF YEAR: 1940 - 2025. Retrieved 2026-10-19. Series: www.whitehouse.gov/wp-content/uploads/2026/04/hist07z1_fy2027.xlsx
Chart imagePermalink

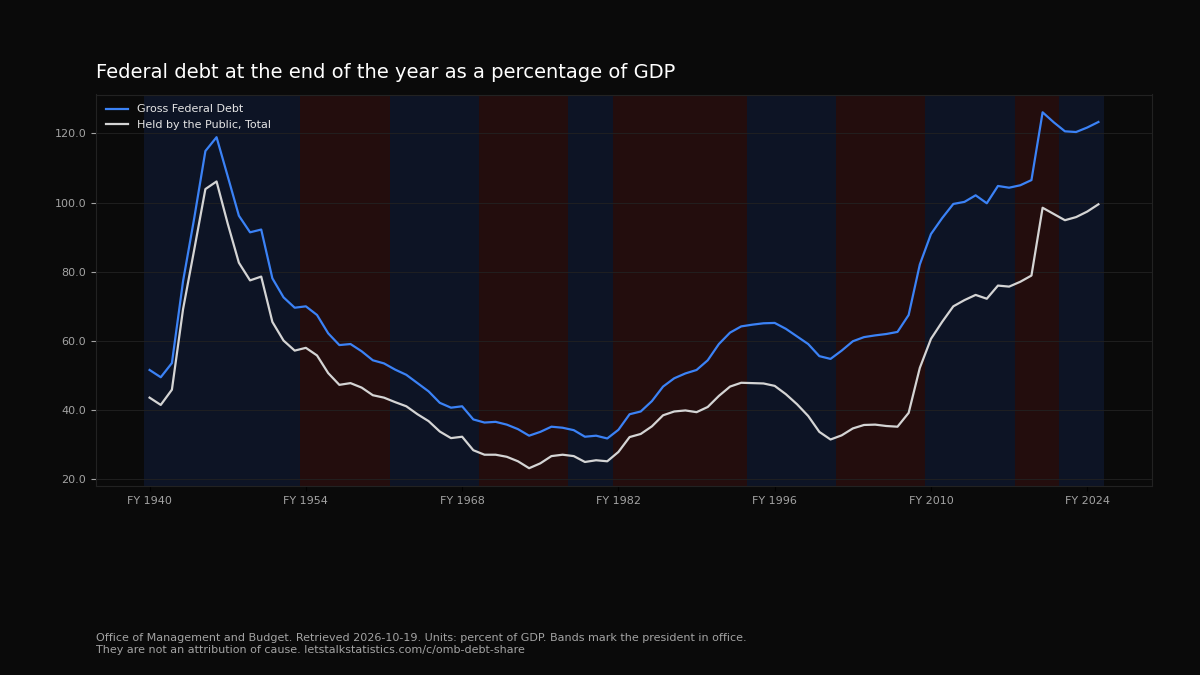
Federal debt at the end of the year as a percentage of GDP

OMB Historical Table 7.1. Percent of GDP.

DemocraticRepublican

Background bands mark who was president. They are not an attribution of cause. Presidents do not solely control these metrics. Monthly points use the president in office on the first day of the month. Calendar year points use the president in office on July 1. Fiscal year points use the president in office on October 1, the first day of that fiscal year. A fiscal year runs through the following September 30 and can include two presidents.

Gross Federal Debt
Units: percent of GDP. Share of GDP. fiscal year.
Table 7.1 - FEDERAL DEBT AT THE END OF YEAR: 1940 - 2025
Source: Office of Management and Budget, Table 7.1 - FEDERAL DEBT AT THE END OF YEAR: 1940 - 2025. Retrieved 2026-10-19. Series: www.whitehouse.gov/wp-content/uploads/2026/04/hist07z1_fy2027.xlsx
Held by the Public, Total
Units: percent of GDP. Share of GDP. fiscal year.
Table 7.1 - FEDERAL DEBT AT THE END OF YEAR: 1940 - 2025
Source: Office of Management and Budget, Table 7.1 - FEDERAL DEBT AT THE END OF YEAR: 1940 - 2025. Retrieved 2026-10-19. Series: www.whitehouse.gov/wp-content/uploads/2026/04/hist07z1_fy2027.xlsx
Chart imagePermalink