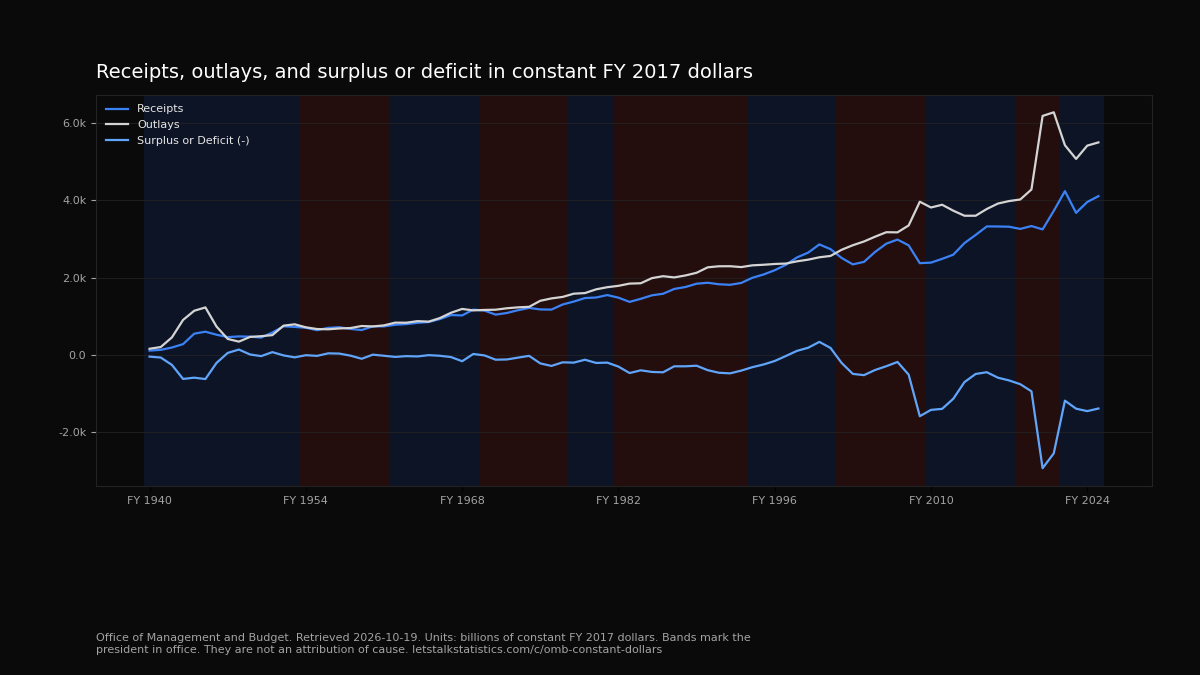
Receipts, outlays, and surplus or deficit in constant FY 2017 dollars
OMB Historical Table 1.3. Billions of constant FY 2017 dollars.
DemocraticRepublican
Background bands mark who was president. They are not an attribution of cause. Presidents do not solely control these metrics. Monthly points use the president in office on the first day of the month. Calendar year points use the president in office on July 1. Fiscal year points use the president in office on October 1, the first day of that fiscal year. A fiscal year runs through the following September 30 and can include two presidents.
- Receipts
- Units: billions of constant FY 2017 dollars. Inflation-adjusted. fiscal year.
- Constant dollars use the composite deflator published in this table. Base: FY 2017 dollars.
- Source: Office of Management and Budget, Table 1.3 - SUMMARY OF RECEIPTS, OUTLAYS, AND SURPLUSES OR DEFICITS ( - ) IN CURRENT DOLLARS, CONSTANT (FY 2017) DOLLARS, AND AS PERCENTAGES OF GDP: 1940 - 2025. Retrieved 2026-10-19. Series: www.whitehouse.gov/wp-content/uploads/2026/04/hist01z3_fy2027.xlsx
- Outlays
- Units: billions of constant FY 2017 dollars. Inflation-adjusted. fiscal year.
- Constant dollars use the composite deflator published in this table. Base: FY 2017 dollars.
- Source: Office of Management and Budget, Table 1.3 - SUMMARY OF RECEIPTS, OUTLAYS, AND SURPLUSES OR DEFICITS ( - ) IN CURRENT DOLLARS, CONSTANT (FY 2017) DOLLARS, AND AS PERCENTAGES OF GDP: 1940 - 2025. Retrieved 2026-10-19. Series: www.whitehouse.gov/wp-content/uploads/2026/04/hist01z3_fy2027.xlsx
- Surplus or Deficit (-)
- Units: billions of constant FY 2017 dollars. Inflation-adjusted. fiscal year.
- Constant dollars use the composite deflator published in this table. Base: FY 2017 dollars.
- Source: Office of Management and Budget, Table 1.3 - SUMMARY OF RECEIPTS, OUTLAYS, AND SURPLUSES OR DEFICITS ( - ) IN CURRENT DOLLARS, CONSTANT (FY 2017) DOLLARS, AND AS PERCENTAGES OF GDP: 1940 - 2025. Retrieved 2026-10-19. Series: www.whitehouse.gov/wp-content/uploads/2026/04/hist01z3_fy2027.xlsx