Index values and prices published by the Bureau of Labor Statistics and the Census Bureau. Adjusted series state the price index and base year in the chart notes.
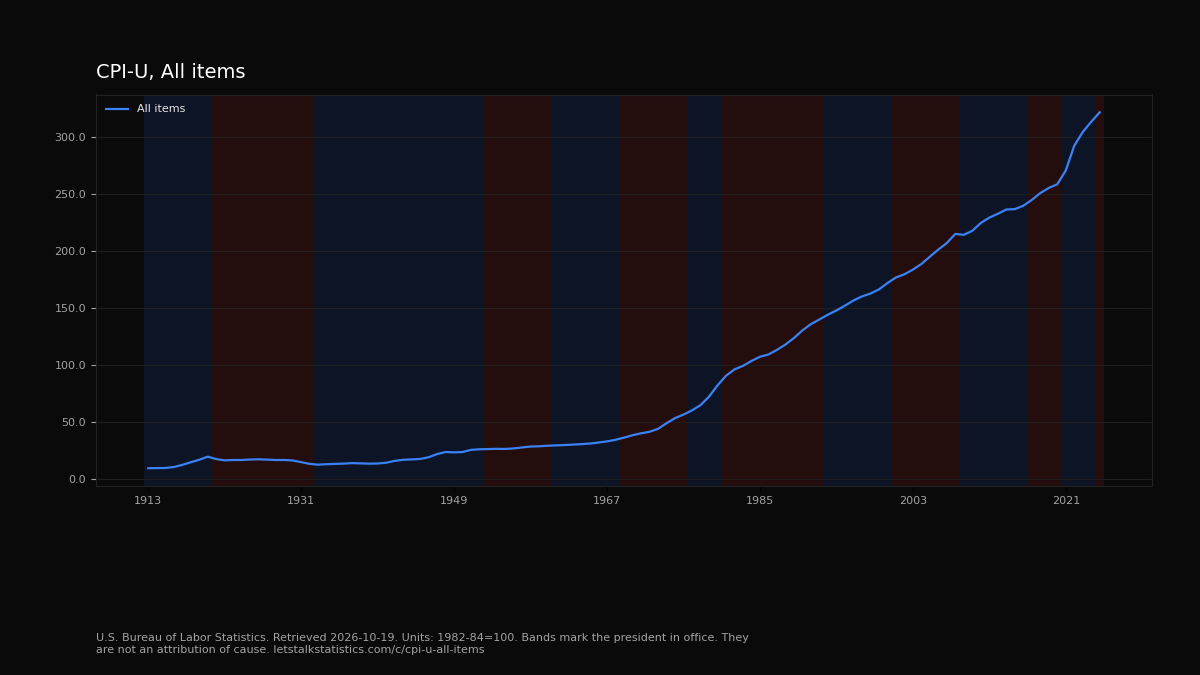
CPI-U, All items
Annual average (period M13). U.S. city average, all urban consumers, not seasonally adjusted.
DemocraticRepublican
Background bands mark who was president. They are not an attribution of cause. Presidents do not solely control these metrics. Monthly points use the president in office on the first day of the month. Calendar year points use the president in office on July 1. Fiscal year points use the president in office on October 1, the first day of that fiscal year. A fiscal year runs through the following September 30 and can include two presidents.
All items
Units: 1982-84=100. Inflation-adjusted. not seasonally adjusted.
Source: U.S. Bureau of Labor Statistics, All items in U.S. city average, all urban consumers, not seasonally adjusted. Retrieved 2026-10-19. Series: data.bls.gov/timeseries/CUUR0000SA0
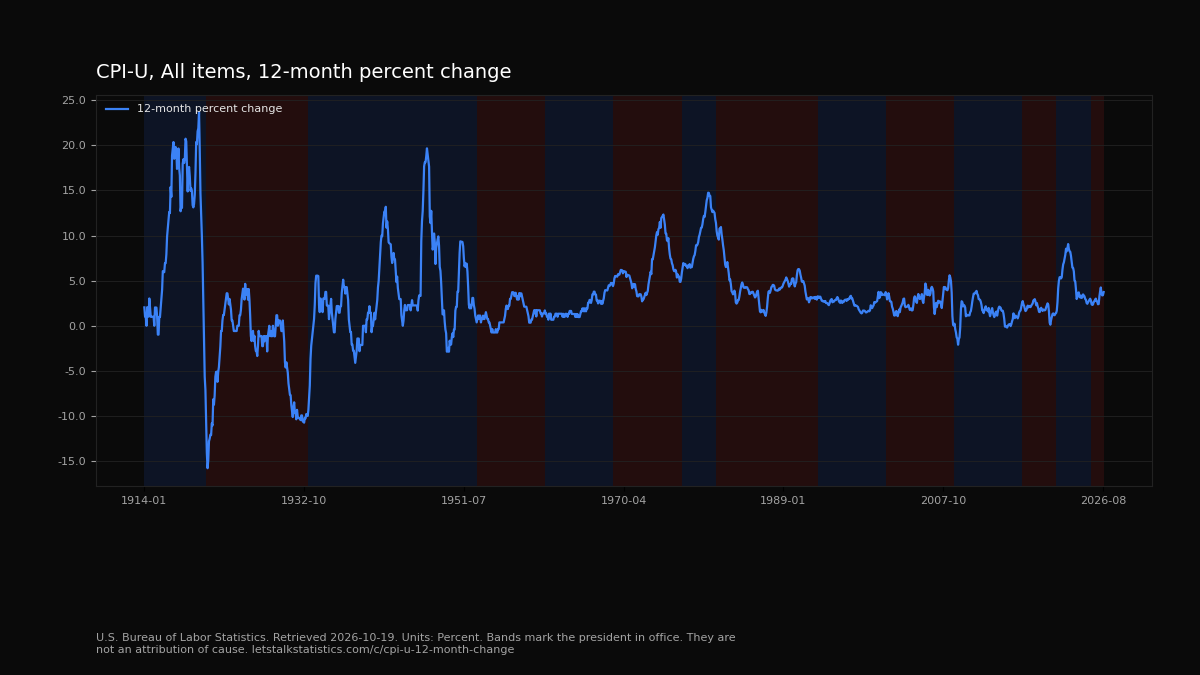
Computed from the CPI-U all-items index. Not seasonally adjusted.
DemocraticRepublican
Background bands mark who was president. They are not an attribution of cause. Presidents do not solely control these metrics. Monthly points use the president in office on the first day of the month. Calendar year points use the president in office on July 1. Fiscal year points use the president in office on October 1, the first day of that fiscal year. A fiscal year runs through the following September 30 and can include two presidents.
12-month percent change
Units: Percent. Percent change. not seasonally adjusted.
Computed as (index this month / index 12 months earlier - 1) x 100. Rounded half up to 3 decimals. Not a separately published BLS percent series.
Source: U.S. Bureau of Labor Statistics, All items in U.S. city average, all urban consumers, not seasonally adjusted. Retrieved 2026-10-19. Series: data.bls.gov/timeseries/CUUR0000SA0
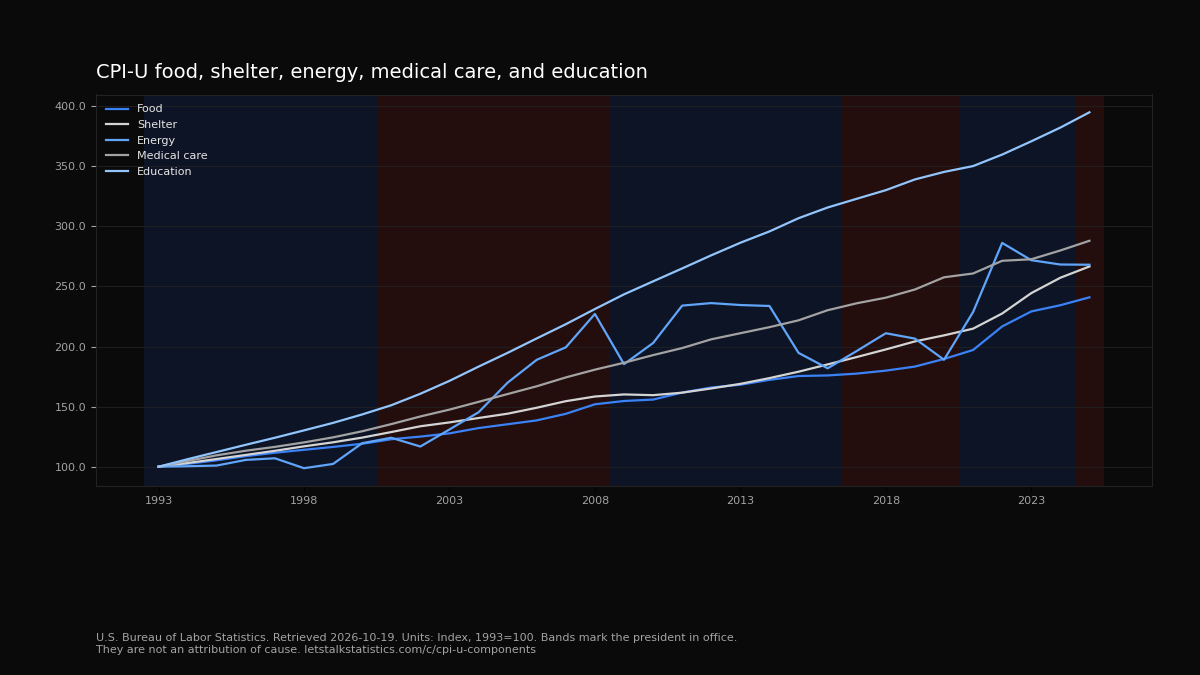
CPI-U food, shelter, energy, medical care, and education
Each line is rebased to 100 in the first year shared by all five series. Published bases differ. Education is December 1997=100. The others shown here are 1982-84=100.
DemocraticRepublican
Background bands mark who was president. They are not an attribution of cause. Presidents do not solely control these metrics. Monthly points use the president in office on the first day of the month. Calendar year points use the president in office on July 1. Fiscal year points use the president in office on October 1, the first day of that fiscal year. A fiscal year runs through the following September 30 and can include two presidents.
Food
Units: Index, 1993=100. Index. not seasonally adjusted. Published units: 1982-84=100.
Published index divided by its 1993 annual average and multiplied by 100. Published base: 1982-84=100. Rounded half up to 3 decimals.
Source: U.S. Bureau of Labor Statistics, Food in U.S. city average, all urban consumers, not seasonally adjusted. Retrieved 2026-10-19. Series: data.bls.gov/timeseries/CUUR0000SAF1
Shelter
Units: Index, 1993=100. Index. not seasonally adjusted. Published units: 1982-84=100.
Published index divided by its 1993 annual average and multiplied by 100. Published base: 1982-84=100. Rounded half up to 3 decimals.
Source: U.S. Bureau of Labor Statistics, Shelter in U.S. city average, all urban consumers, not seasonally adjusted. Retrieved 2026-10-19. Series: data.bls.gov/timeseries/CUUR0000SAH1
Energy
Units: Index, 1993=100. Index. not seasonally adjusted. Published units: 1982-84=100.
Published index divided by its 1993 annual average and multiplied by 100. Published base: 1982-84=100. Rounded half up to 3 decimals.
Source: U.S. Bureau of Labor Statistics, Energy in U.S. city average, all urban consumers, not seasonally adjusted. Retrieved 2026-10-19. Series: data.bls.gov/timeseries/CUUR0000SA0E
Medical care
Units: Index, 1993=100. Index. not seasonally adjusted. Published units: 1982-84=100.
Published index divided by its 1993 annual average and multiplied by 100. Published base: 1982-84=100. Rounded half up to 3 decimals.
Source: U.S. Bureau of Labor Statistics, Medical care in U.S. city average, all urban consumers, not seasonally adjusted. Retrieved 2026-10-19. Series: data.bls.gov/timeseries/CUUR0000SAM
Education
Units: Index, 1993=100. Index. not seasonally adjusted. Published units: DECEMBER 1997=100.
Published index divided by its 1993 annual average and multiplied by 100. Published base: DECEMBER 1997=100. Rounded half up to 3 decimals.
Source: U.S. Bureau of Labor Statistics, Education in U.S. city average, all urban consumers, not seasonally adjusted. Retrieved 2026-10-19. Series: data.bls.gov/timeseries/CUUR0000SAE1
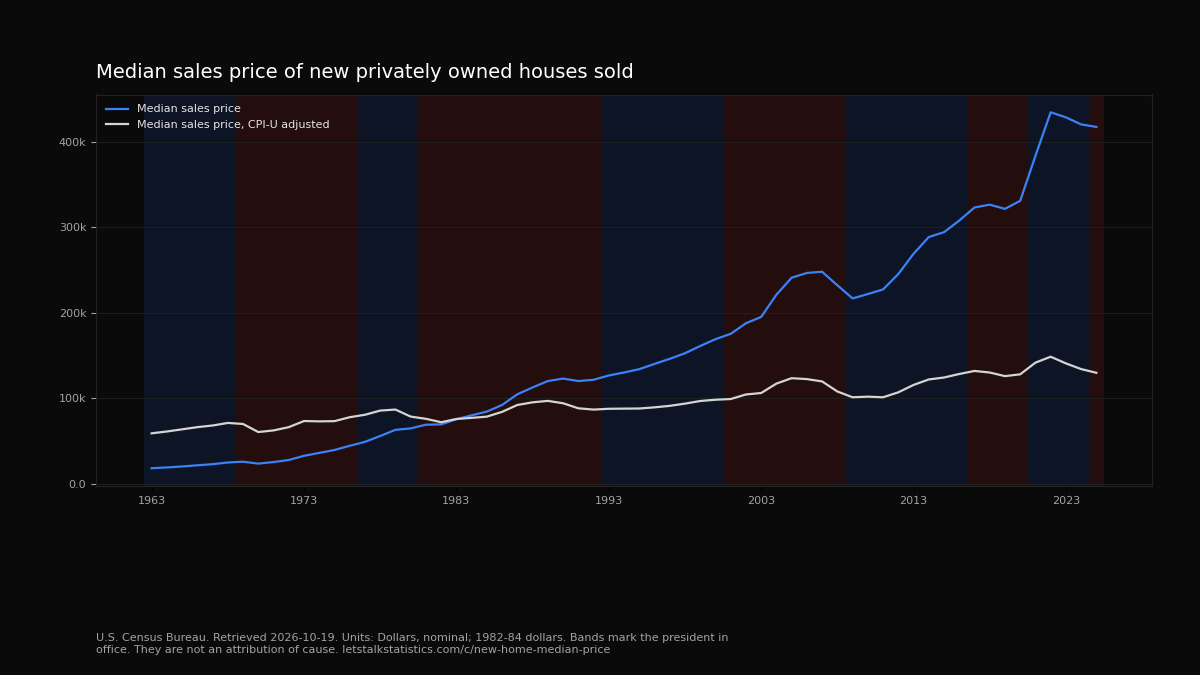
Median sales price of new privately owned houses sold
United States. New houses only. The sales price includes the land. The inflation-adjusted line uses CPI-U, base 1982-84=100.
DemocraticRepublican
Background bands mark who was president. They are not an attribution of cause. Presidents do not solely control these metrics. Monthly points use the president in office on the first day of the month. Calendar year points use the president in office on July 1. Fiscal year points use the president in office on October 1, the first day of that fiscal year. A fiscal year runs through the following September 30 and can include two presidents.
Median sales price
Units: Dollars, nominal. Nominal. not inflation-adjusted.
Sales Price of New Privately-Owned Houses Sold. United States. Note: The sales price includes the land. New privately owned houses sold. This is not the price of existing homes.
Units: 1982-84 dollars. Inflation-adjusted. inflation-adjusted with CPI-U, base 1982-84=100.
Median sales price times 100, divided by the CPI-U all-items annual average for that year. CPI-U base is 1982-84=100. Rounded half up to cents. Census does not publish this adjusted series.